

Recent News

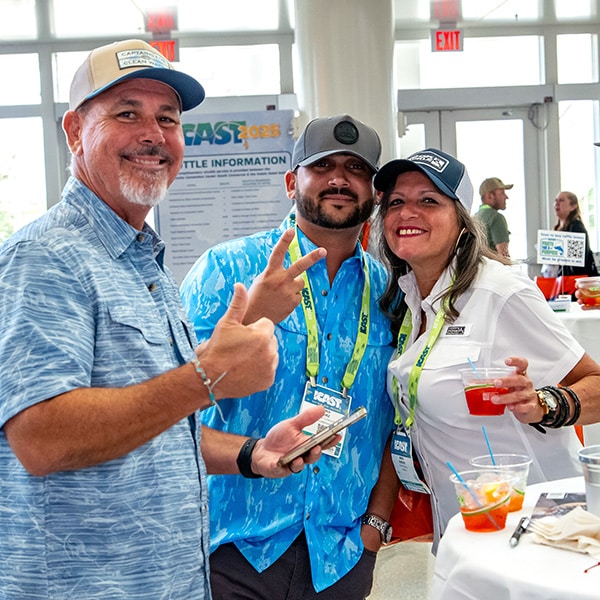
Attend the World’s Premier Sportfishing Trade Show
Join industry leaders & emerging innovators at the ultimate gathering in sportfishing commerce. Learn More
BEWARE of ICAST Hotel Scams
ASA has received reports of unauthorized companies contacting attendees to help with hotel reservations. These companies are not affiliated with ICAST or the official event hotels and are not authorized to book rooms on our behalf. Eventsphere is the ONLY official ICAST housing vendor.

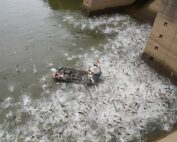
Fish unintentionally caught and killed in the Gulf as bycatch by industrial menhaden operations.

Working for YOU
We take care of the politics so you can concentrate on growing your business.


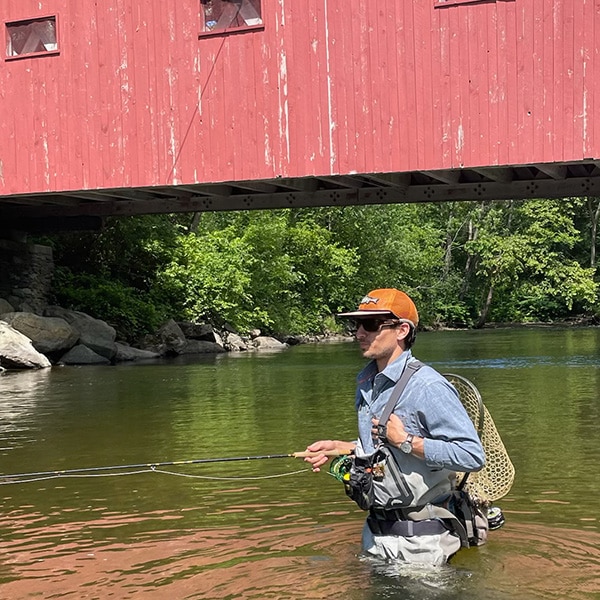
Efforts are underway to prevent the use of lead tackle for fishing despite scant evidence that using lead has a harmful impact on wildlife populations.
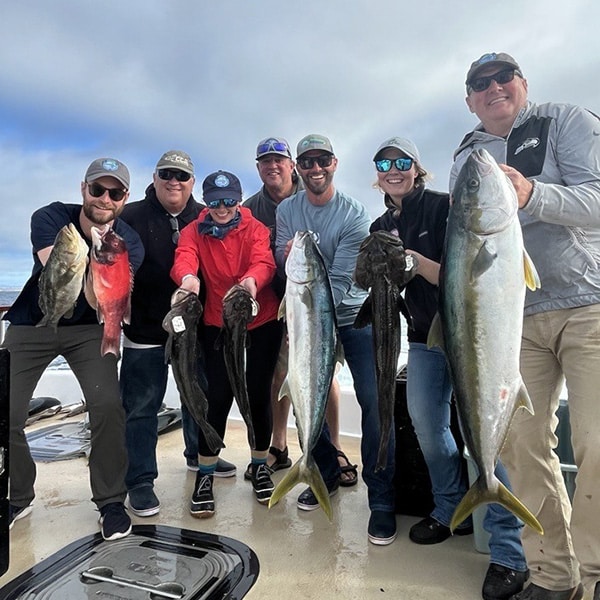
Recruitment, Retention and Reactivation—known as R3—is a nationwide movement to grow and sustain participation in recreational fishing.
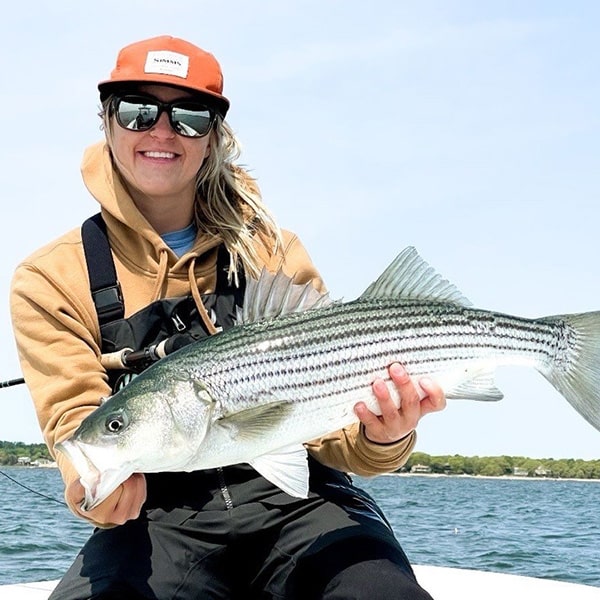
Striped bass are one of the most important fisheries on the Atlantic coast. In fact, striped bass are the most caught saltwater fish in terms of pounds by recreational anglers.
Since taking office, the Trump Administration is taking many actions on tariffs that impact the sportfishing industry, ASA is monitoring, weighing in with the Administration & Congress.